(Credit - Dubai Roads and Transport Authority (RTA))
Dubai RTA Ridership Over Eid Al Adha Reaches 8.2 Million in Five Days
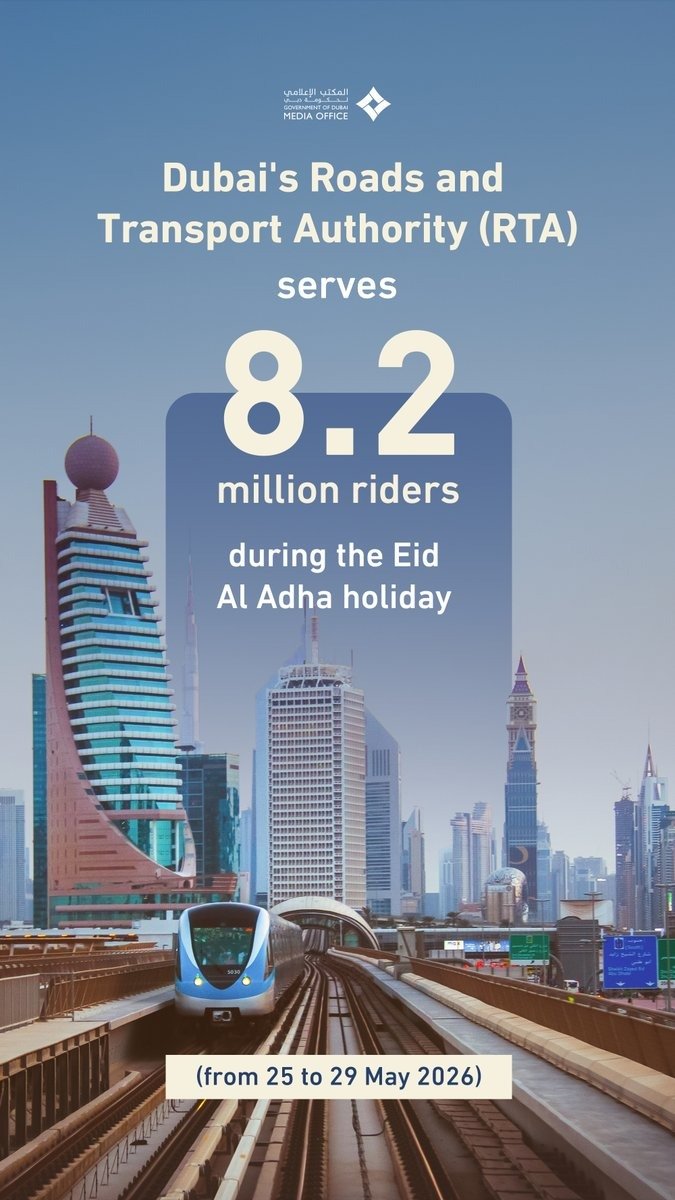
Dubai RTA ridership over Eid Al Adha hit 8.2 million across public transport and mobility services between 25 and 29 May, the Roads and Transport Authority (RTA) confirmed, averaging roughly 1.64 million trips per day across Metro, buses, marine transport, taxis, and shared mobility.
What 8.2 Million Trips in Five Days Actually Tells You
The five-day window covers one of the UAE’s highest-mobility periods of the year. Family visits, shopping runs, and leisure travel all converge simultaneously, pushing demand onto mass transit corridors and on-demand services that would otherwise see steady but predictable weekday loads.
The Dubai Metro, operating the Red and Green lines, typically absorbs the heaviest volumes on high-density corridors, while buses and marine services (abras, ferries, water buses) extend coverage to waterfront districts and residential feeders. Taxis and shared mobility pick up the late-night, last-mile, and family-group trips that fixed-route services don’t fully capture.
How the Eid Surge Fits the Bigger Picture
The RTA‘s full-year 2025 network total stood at 802 million riders across public transport, shared mobility, and taxis, a figure that frames the Eid period not as an outlier but as a concentrated expression of the city’s daily movement economy. Five days of Eid travel alone accounted for roughly 1% of that annual total, which signals how sharply demand compresses during peak holiday windows.
| Mode | Role in the Network | Holiday Demand Pattern | Resident Impact |
|---|---|---|---|
| Dubai Metro (Red & Green Lines) | High-capacity backbone corridors | Highest volume, mall, interchange & tourist routes | Expect crowding at major stations; allow extra journey time |
| Public Buses | Feeder & residential coverage | Elevated on routes linking Metro to neighbourhoods | Frequency may tighten; check RTA app for real-time loads |
| Marine Transport (Abras, Ferries, Water Buses) | Waterfront & creek connectivity | Spikes for leisure and cross-creek trips | Queues at Dubai Creek and marina stops during peak hours |
| Taxis | On-demand, door-to-door | High demand for late-night and family-group travel | Surge pricing possible; book in advance via app |
| Shared Mobility | Last-mile and flexible trips | Absorbs overflow from fixed-route services | Availability tightens near large interchanges |
Three Wallet Scenarios: Renter, Job-Seeker, Business Owner
If you’re a renter living near a Metro station, the 8.2 million Eid figure reinforces that your proximity to transit carries real financial value. Car-free living during peak periods is operationally viable in Dubai, and with annual network ridership at 802 million, service frequency is structured around sustained, high-volume demand, not occasional use.If you’re a job-seeker, roles in retail, hospitality, and facilities management near major Metro interchanges and mall corridors are directly tied to footfall patterns like these. An employer advertising shifts around Eid or other peak periods is responding to exactly this kind of ridership data, and demonstrating that transit-accessible locations drive consistent customer volumes.If you’re a business owner operating near a key station or interchange, 8.2 million riders over five days is a staffing and stock-planning signal, not just a headline. Businesses that align opening hours, delivery windows, and floor staffing to RTA peak schedules, rather than standard weekday patterns, are better positioned to convert that footfall into revenue without being caught short on capacity.Dubai’s RTA logged 8.2 million riders across all transport and mobility modes during the Eid Al Adha period from 25 to 29 May, against a full-year 2025 network total of 802 million. The numbers confirm that public transport is the practical default for millions of residents and visitors during high-demand periods, not a backup option. For anyone whose income, rent, or business depends on where people move in this city, these figures are a direct operational input.